If you’re a web developer using a Mac, you’re in luck. Macs come with powerful built-in web development tools that can help you inspect and analyze your website’s HTML, CSS, and JavaScript.
In this article, you’ll learn how to master these tools and take your web development skills to the next level.
First, we’ll dive into understanding the Mac’s web development tools. You’ll discover how to examine HTML elements and structure, allowing you to easily identify and manipulate specific parts of your website.
Next, we’ll explore analyzing CSS styles and layouts, enabling you to make precise design changes and ensure a visually appealing website.
But web development isn’t just about aesthetics, it’s also about functionality. That’s why we’ll cover how to debug JavaScript and troubleshoot errors, ensuring your website runs smoothly and efficiently.
Additionally, you’ll learn how to monitor network activity and performance, so you can optimize your website for speed and responsiveness.
By the end of this article, you’ll have the knowledge and confidence to use Mac’s built-in web development tools like a pro. So let’s get started and take your web development skills to new heights!
Key Takeaways
- Macs have powerful built-in web development tools for inspecting and analyzing HTML, CSS, and JavaScript.
- The Web Inspector allows real-time viewing and modification of HTML, CSS, and JavaScript code, as well as analysis of network activity and resource usage.
- The Inspect Element feature and Developer Tools panel make it easy to examine and navigate HTML elements on a webpage, analyze CSS properties and styles, and troubleshoot layout issues.
- The Console panel in Safari’s Web Inspector is used for debugging JavaScript, monitoring network activity, and optimizing performance.
Understanding the Mac’s Web Development Tools
To truly grasp the intricacies of the Mac’s web development tools, you should familiarize yourself with their functionality and purpose.
These tools are designed to assist you in inspecting and debugging web pages, making it easier to identify and fix any issues or errors.
The main tool you’ll be using is the Web Inspector, which allows you to view and modify the HTML, CSS, and JavaScript code of a webpage in real-time. With the Web Inspector, you can also analyze network activity, monitor resource usage, and simulate different device and screen sizes.
Additionally, the Mac’s web development tools include a JavaScript console, which allows you to test and debug JavaScript code directly from the browser.
By understanding and utilizing these tools effectively, you’ll be able to streamline your web development process on your Mac.
Examining HTML Elements and Structure
Take a closer look at the structure and elements of your HTML with the amazing tools available on your Mac.
With the built-in web development tools, you can easily examine and understand the HTML elements in your web page. By using the Inspect Element feature, simply right-click on any element on your webpage and select ‘Inspect Element’ from the menu.
This will open the Developer Tools panel, where you can view the HTML code for that particular element. You can also navigate through the HTML structure by expanding and collapsing the elements.
Additionally, you can hover over an element to see its CSS properties and styles. This allows you to inspect and analyze the HTML structure and elements of your web page in detail, helping you to identify and fix any issues or make necessary changes.
Analyzing CSS Styles and Layouts
Explore the incredible power of your Mac’s built-in web development tools to uncover the secrets behind CSS styles and layouts. With these tools, you can easily analyze and understand the CSS properties applied to elements on a webpage, allowing you to make informed decisions when it comes to design and layout.
Start by opening the Elements tab in the Web Inspector, and select the element you want to inspect. In the Styles pane, you’ll find a list of all the CSS styles applied to that element, including inherited styles and styles from different sources. You can also see how these styles affect the layout of the page, by using the Layout pane.
Here, you can visualize the box model, margins, padding, and positioning of the selected element.
By examining CSS styles and layouts, you can fine-tune your web design, troubleshoot layout issues, and understand how different styles interact with each other.
So go ahead, unleash the power of your Mac’s web development tools and become a CSS master.
Debugging JavaScript and Troubleshooting Errors
Troubleshooting JavaScript errors is essential for enhancing your web development skills and ensuring smooth functionality on your website. With Mac’s built-in web development tools, you’ve got powerful features at your fingertips to debug JavaScript and identify errors quickly.
The Console panel in Safari’s Web Inspector is your go-to tool for debugging JavaScript. It provides a real-time display of errors, logs, and warnings, allowing you to pinpoint the exact line of code causing the issue.
You can also set breakpoints in your JavaScript code, allowing you to pause the execution and inspect variables, objects, and function calls. Additionally, Safari’s Web Inspector offers a powerful JavaScript debugger, which lets you step through your code, set watch expressions, and examine the call stack.
By mastering these tools, you can efficiently troubleshoot JavaScript errors and optimize your website’s performance.
Monitoring Network Activity and Performance
To effectively enhance your web development skills, you can utilize Safari’s Console panel in the Web Inspector to monitor network activity and optimize performance on your website.
The Console panel provides valuable information about network requests, such as their status, size, and timing. It allows you to identify any slow or failing requests, as well as analyze the data transferred between the client and the server.
Additionally, you can view detailed information about each request, including headers, cookies, and response bodies. By monitoring network activity, you can identify potential bottlenecks or performance issues and take appropriate measures to optimize your website’s loading speed.
Safari’s Console panel also provides useful tools for analyzing and debugging network-related problems, making it an essential tool for web developers working on a Mac.
Optimizing Your Websites for Efficiency
Maximize the efficiency of your websites by implementing optimization techniques that will enhance user experience and loading speed.
One way to optimize your website is by compressing and minifying your code, which reduces the file size and improves loading times.
You can also optimize images by resizing them and using the appropriate file format.
Another technique is to enable caching, which stores certain elements of your website on the user’s device, making subsequent visits faster.
Additionally, you should optimize your CSS and JavaScript files by combining and minifying them. This reduces the number of requests made to the server and improves loading speed.
Lastly, consider using a content delivery network (CDN) to distribute your website’s resources across multiple servers, improving performance for users in different locations.
By implementing these optimization techniques, you can significantly enhance the efficiency and speed of your websites.
Frequently Asked Questions
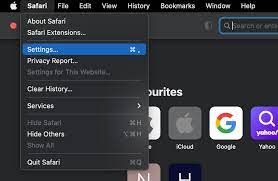
To customize the appearance of the web development tools on your Mac, go to Preferences in the web browser’s menu. From there, you can change the theme, font size, and other settings to suit your preferences.
Yes, you can use Mac’s web development tools to inspect and debug websites on mobile devices. It allows you to view the HTML, CSS, and JavaScript code, analyze network requests, and debug any issues on your mobile site.
Yes, there are hidden features and keyboard shortcuts in Mac’s web development tools that can improve your workflow. They allow you to quickly navigate, inspect elements, and debug websites, making your web development process more efficient.
To test and optimize your website’s performance on different browsers using Mac’s web development tools, open the inspector, go to the Network tab, and select the browser you want to test. Analyze the load times and optimize accordingly.
Yes, you can use Mac’s web development tools to analyze and optimize your website’s accessibility for users with disabilities. These tools provide valuable insights and help you make necessary improvements.
Conclusion
In conclusion, mastering Mac’s built-in web development tools is essential for any web developer looking to optimize their websites. By understanding how to inspect HTML elements, analyze CSS styles, and debug JavaScript, you can effectively troubleshoot errors and improve the overall performance of your websites.
Additionally, monitoring network activity and optimizing for efficiency will ensure that your websites are running smoothly. So, take advantage of these powerful tools on your Mac and enhance your web development skills today.