Are you a Mac user looking to learn how to inspect elements on your browser? Look no further!
In this step-by-step tutorial, we will guide you through the process of inspecting elements on your Mac using the Developer Tools. Whether you’re a web developer, designer, or simply curious about how websites are built, inspecting elements can provide valuable insights.
By accessing the Elements Panel, you can navigate through the HTML structure of a webpage, modify elements, and analyze CSS styles and layout.
Additionally, you’ll learn how to debug JavaScript code and use the Console for testing and troubleshooting.
So, grab your Mac and get ready to dive into the world of web development with this comprehensive tutorial.
Let’s get started!
Key Takeaways
- Developer Tools on a Mac provide access to HTML, CSS, and JavaScript code
- Elements Panel allows viewing and manipulation of HTML and CSS
- Analyze CSS styles by right-clicking on an element and selecting ‘Inspect Element’
- Console is a valuable tool for testing and troubleshooting JavaScript code
Opening the Developer Tools on your Mac
Now, let’s dive into how you can effortlessly open the Developer Tools on your Mac and unveil the hidden treasures of web development.
To begin, you need to open up your web browser. Whether you prefer Safari, Chrome, or Firefox, the process is similar across all platforms.
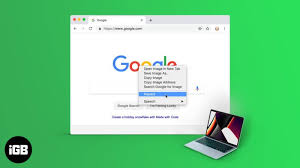
First, open the browser and navigate to the webpage you want to inspect. Once you’re on the desired webpage, simply right-click anywhere on the page and select ‘Inspect Element’ from the drop-down menu. Alternatively, you can use the keyboard shortcut by pressing Command + Option + I.
This will open up the Developer Tools panel, giving you access to a plethora of valuable information about the webpage’s HTML, CSS, and JavaScript code.
With the Developer Tools open, you can now explore and manipulate the elements on the page to your heart’s content.
Navigating the Elements Panel
Easily explore and uncover hidden website secrets using the Elements Panel on your Mac. Once you’ve opened the Developer Tools, you’ll see a menu at the top of the screen. Click on the ‘Elements’ tab to access the Elements Panel.
This panel allows you to view and manipulate the HTML and CSS of the webpage you’re inspecting. The Elements Panel is divided into two sections: the HTML structure on the left and the CSS styles on the right. You can expand or collapse HTML elements by clicking on the arrow icons, making it easier to navigate through the code.
By selecting an HTML element, you can see its corresponding styles and properties on the right side. This makes it simple to identify and modify specific elements on the webpage.
Inspecting and Modifying HTML Elements
To uncover the hidden secrets of a website, dive into the world of HTML elements by exploring and modifying them with the powerful tools at your disposal.
With the Elements Panel open, you can easily inspect and modify HTML elements on your Mac. Simply hover over an element in the page preview or use the search bar to locate a specific element.
Once you’ve found the element you want to inspect, click on it to reveal its HTML code and related CSS styles. From here, you can make changes to the code directly in the Elements Panel and see the results in real-time.
Whether you want to tweak the layout, update the text, or experiment with different styles, inspecting and modifying HTML elements is a breeze on your Mac.
Analyzing CSS Styles and Layout
Uncover the mesmerizing world of CSS styles and layout analysis, always leaving you in awe of the intricate web designs. With the Inspect Element tool on your Mac, you’ve got the power to delve into the secrets of CSS and understand how a webpage’s visual elements come together.
To analyze CSS styles, simply right-click on an element and select ‘Inspect Element.’ A panel will open, displaying the HTML and CSS code of that element. You can navigate through the CSS rules to see how different styles are applied. By hovering over a CSS property, you can even see its impact on the element in real-time.
Layout analysis is equally fascinating. The ‘Box Model’ tab in the Inspect Element panel provides valuable insights into an element’s size, position, and spacing. You can experiment by modifying these values and observe how the layout changes accordingly.
With CSS style and layout analysis, you can unravel the mysteries behind captivating web designs and gain a deeper understanding of the artistry behind them.
Debugging JavaScript Code
Get ready to dive into the world of debugging JavaScript code and uncover the hidden bugs that can make or break a website’s functionality!
When inspecting JavaScript code in the Elements panel of the Inspect Element tool on your Mac, you can identify and fix issues that may be causing your code to malfunction.
By analyzing the console logs, you can spot any error messages or warnings that can help you pinpoint the problem areas in your code.
You can also set breakpoints to pause the execution of your JavaScript code and step through it line by line to identify the exact point where the issue arises.
Additionally, the Sources panel allows you to modify and experiment with your JavaScript code in real-time to test different scenarios and find the optimal solution.
Debugging JavaScript code is an essential skill for any web developer, and with the Inspect Element tool on your Mac, you have all the necessary tools at your fingertips.
So, start exploring and debugging your JavaScript code to create seamless and error-free websites!
Using the Console for Testing and Troubleshooting
The console is a valuable tool for testing and troubleshooting JavaScript code. It helps you identify and fix any issues that may be hindering your website’s performance.
The console allows you to run JavaScript code directly in your browser. This enables you to quickly test and debug your code without making any permanent changes to your website.
By using the console, you can easily check for errors, log information, and interact with your code in real-time. You can also use it to modify variables and functions on the fly, allowing you to test different scenarios and see the immediate effects.
Additionally, the console provides a helpful environment for experimenting with new code ideas and testing their functionality.
Overall, the console is an essential tool for any JavaScript developer. It provides a convenient way to test and troubleshoot your code.
Frequently Asked Questions
No, you cannot use the inspect element feature on Mac to permanently edit and save changes to a website. It only allows you to view and make temporary modifications for testing or debugging purposes.
Yes, you can inspect and modify HTML elements of a password-protected or authenticated webpage. Simply open the Inspect Element tool, navigate to the HTML code, make your modifications, and save them.
To view and modify the source code of a webpage using the inspect element feature on your Mac, simply right-click on the page, select “Inspect” from the dropdown menu, and navigate to the “Elements” tab.
Yes, you can use the inspect element feature to modify the appearance of a webpage temporarily without affecting the original design. It allows you to make changes and see how they look without permanently altering the webpage.
Yes, you can use the inspect element feature on Mac to debug and troubleshoot server-side code or database queries. It allows you to view and manipulate the HTML, CSS, and JavaScript of a webpage, making it useful for identifying and fixing backend issues.
Conclusion
In conclusion, inspecting elements on your Mac using the Developer Tools is a powerful tool for web developers and designers. By navigating the Elements Panel, you can easily inspect and modify HTML elements, analyze CSS styles and layout, and even debug JavaScript code.
The console also provides a handy space for testing and troubleshooting. With these step-by-step instructions, you can confidently utilize the inspect element feature on your Mac and enhance your web development skills.


